Monitoring your Merge Queue
Monitor key metrics of your merge queue to improve throughput and reduce latency.
Monitoring your merge queue’s key metrics helps you identify bottlenecks, optimize throughput, and maintain an efficient development cycle.
The Statistics Page
Section titled The Statistics PageOpen Merge Queue → Statistics in your dashboard to see how your queue is behaving:
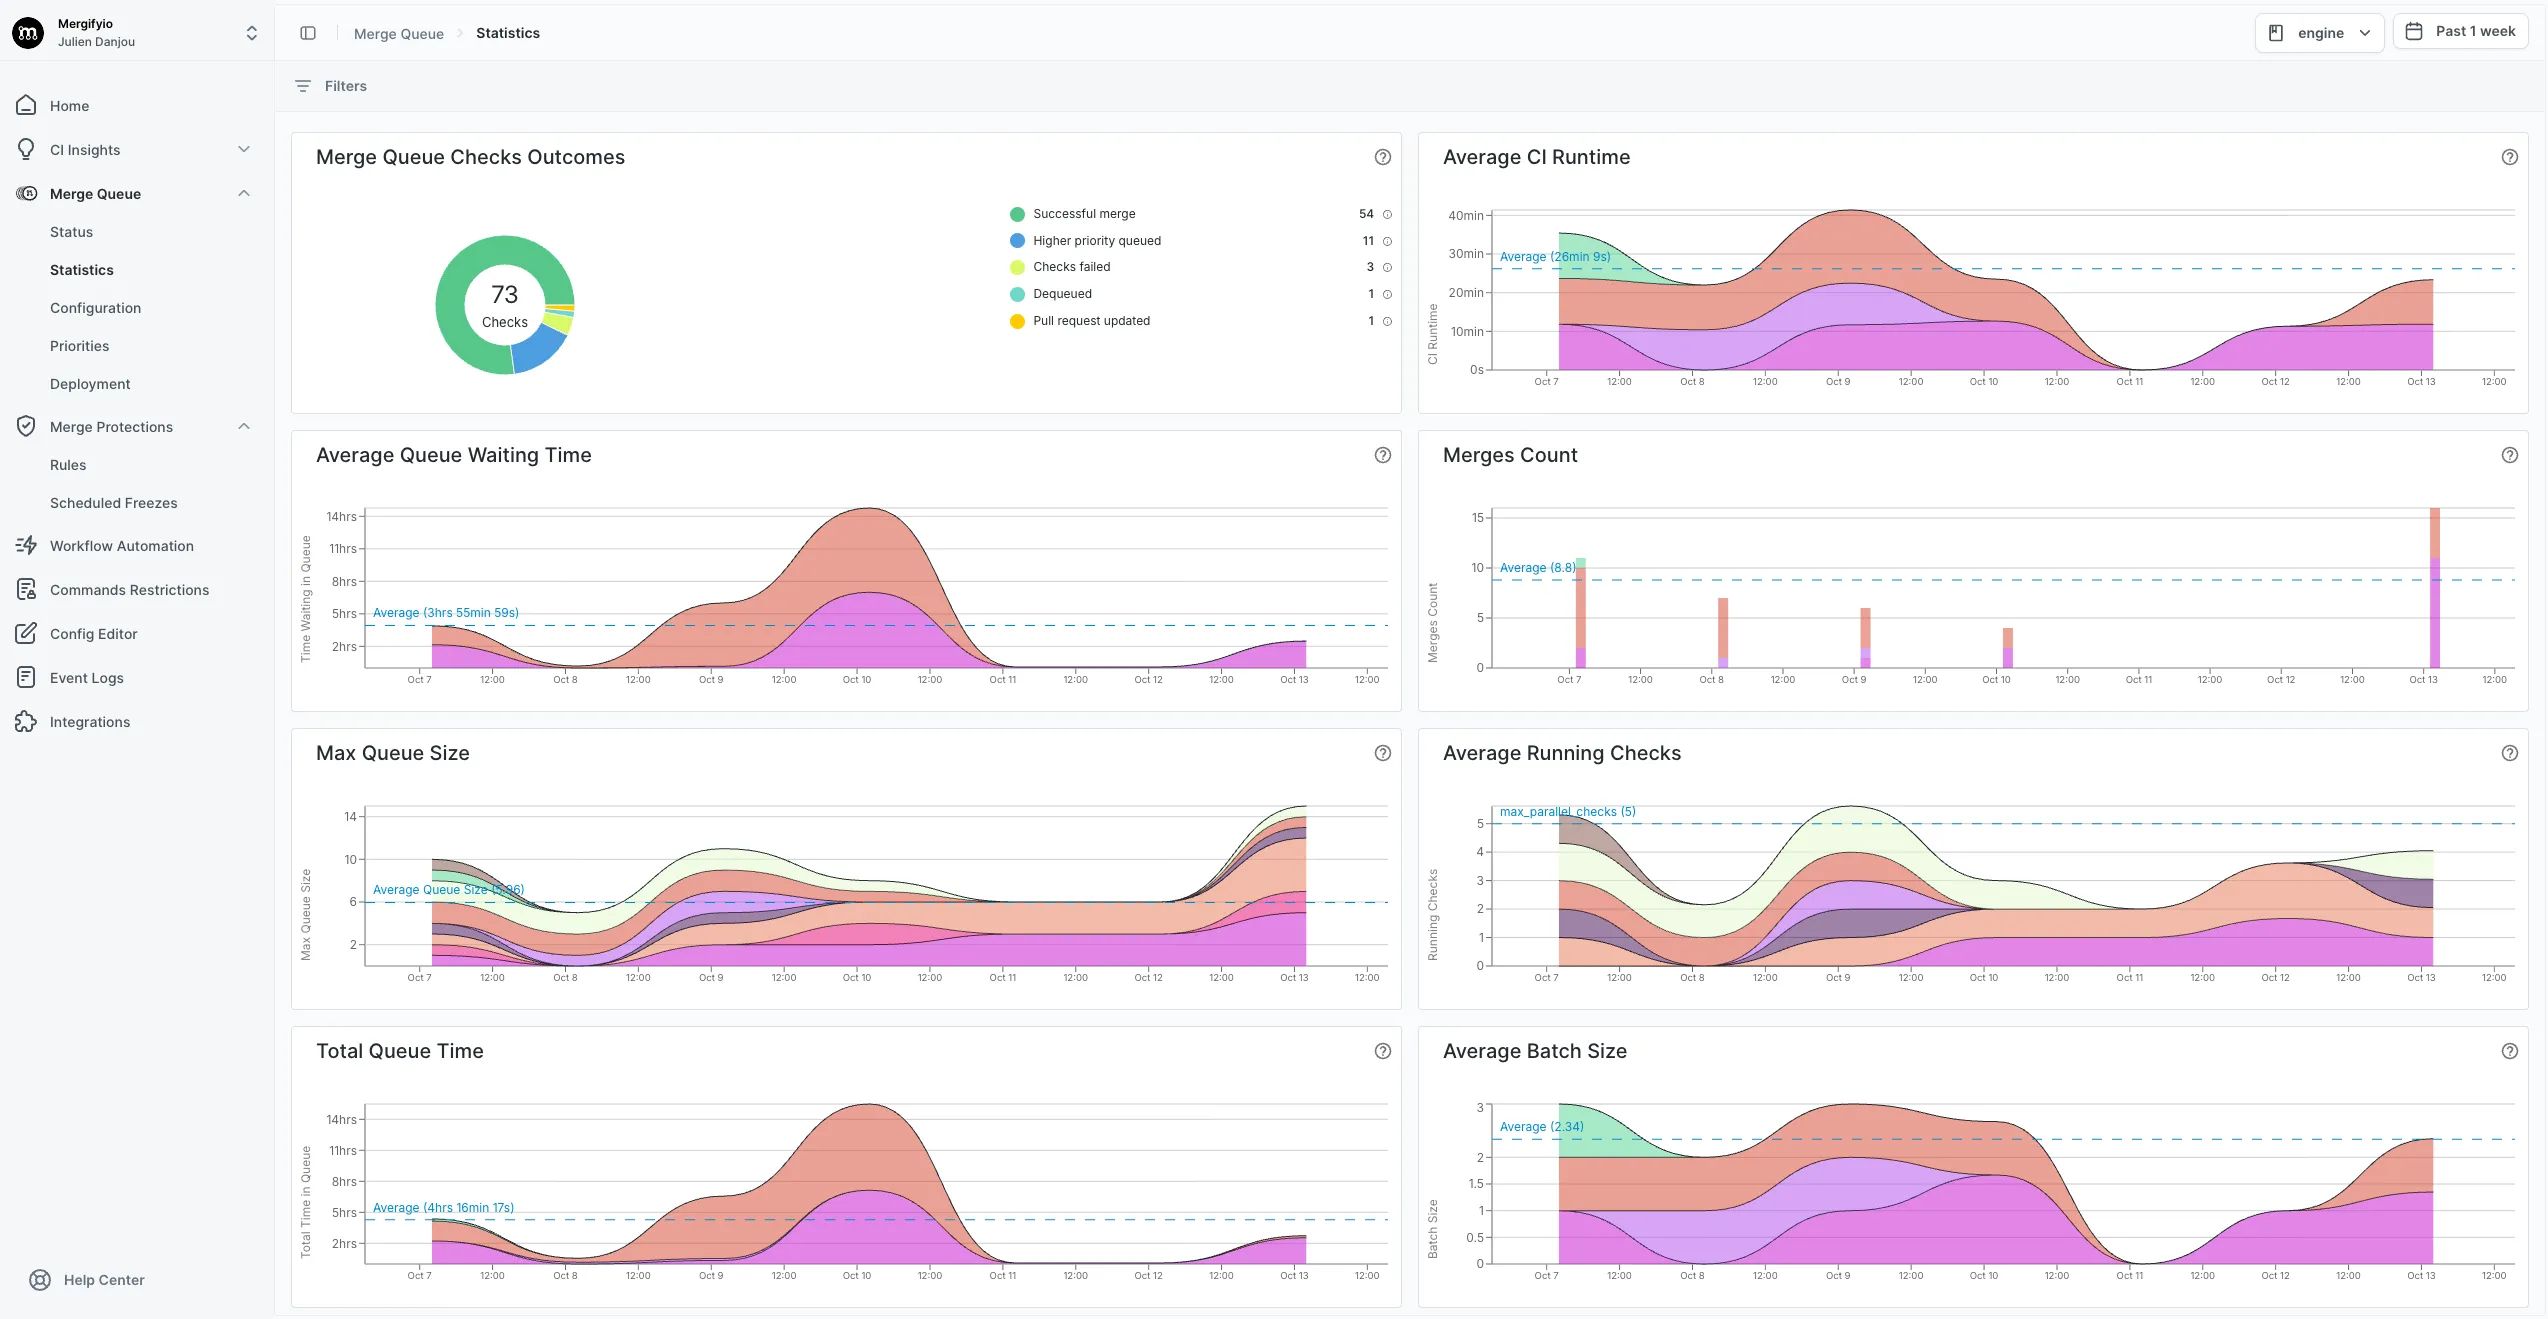
Use the date picker to select the time range you want to review. Presets go up to “Past 3 months”. Queue data is retained for 90 days, so the oldest day or two of that longest preset can come back empty. A repository selector and filters narrow every widget on the page at once.
A row of headline figures sits at the top: pull requests entered and merged, the merged rate, time spent waiting for CI, max queue size, throughput, queue time, CI runtime, and CI failure rate. Below it, the widgets are grouped into three sections.
Queue Health
Section titled Queue HealthExit reasons, interruptions, and failure trends.
-
PR Exit Reasons: how pull requests leave the queue. The distribution view counts each pull request once by its final exit reason; the over-time view shows how those reasons trend.
-
Batch Outcomes: the outcome of every CI run the queue triggered, including batch results, bisection attempts, and queue resets. One pull request can produce several runs.
-
Checks Retries: how often checks are retried, and how often a retry ends in a merge. A low recovery rate points at genuinely broken tests rather than flaky ones.
-
CI Failure Rate: the share of queue CI runs that failed. A rising rate usually means flaky tests, unstable CI, or problematic changes being queued.
-
Batch Bisection Count: how often Mergify had to split a failing batch to find the culprit. A high count means batches are failing often.
Throughput
Section titled ThroughputVolume of pull requests processed and queue capacity.
-
Entered PRs and Merged PRs: how many pull requests joined and left the queue over time. A consistent trend indicates a stable development environment; sudden drops or spikes are worth investigating.
-
Max Queue Size: the largest the queue got. The reference line marks your max checks capacity (max batch size ×
max_parallel_checks), so a queue above the line means pull requests are waiting for a free check slot. -
Average Batch Size: the reference line shows the largest
batch_sizeconfigured across your queue rules. Sitting at the maximum suggests the queue is saturated. -
Max Running Checks: peak concurrent checks. If you are often at capacity, raising
max_parallel_checksimproves throughput.
Performance
Section titled PerformanceQueue timing and CI execution speed.
-
Time Breakdown: how a pull request’s time in queue splits across waiting for CI capacity, schedule windows, freeze periods, and CI runtime. Switch each component between Avg, P95, and Max to see whether the queue is usually fast with rare spikes or consistently slow. Only the average is additive, so the total in the center is shown for Avg only. If capacity wait dominates, raise
max_parallel_checks. -
Average Queue Time: the full time a pull request spent in the queue.
-
Average CI Runtime: how long your CI takes. An increase here slows the whole queue down.
-
Batches Saved: batches that merged without running their own speculative checks, because a later batch containing their changes had already passed. Each one is a CI run the queue avoided. This requires
skip_intermediate_resultson the queue.
Monitoring the Queue with the CLI
Section titled Monitoring the Queue with the CLIYou can check your merge queue status from the command line with the Mergify
CLI. The queue CLI reference lists every command and flag.
mergify queue statusThis displays:
-
Pause status: whether the queue is paused, with reason and elapsed time
-
Batches: batches organized by scope with status indicators and their pull requests
-
Waiting PRs: queued pull requests with priority, queue time, and estimated merge time
To filter results to a specific branch:
mergify queue status --branch mainUse --json for machine-readable output:
mergify queue status --jsonInspecting a Pull Request
Section titled Inspecting a Pull RequestTo see the detailed state of a specific pull request in the queue:
mergify queue show <pr_number>This displays the PR’s position, priority, queue rule, CI checks summary, and
blocking conditions. Use --verbose (-v) for the full checks table and
conditions tree:
mergify queue show 123 --verboseIntegrations
Section titled IntegrationsYou can also build your own monitoring solution using the Mergify API.
Was this page helpful?
Thanks for your feedback!